ST 4U 307: Pinpoint Benchmarking
Today's Smalltalk 4 You looks at more pinpointed benchmarking in Smalltalk - measuring the execution time of a specific block of code. If you have trouble viewing it here in the browser, you can also navigate directly to YouTube. To watch now, click on the image below:
If you have trouble viewing that directly, you can click here to download the video directly. If you need the video in a Windows Media format, then download that here.
You can also watch it on YouTube:
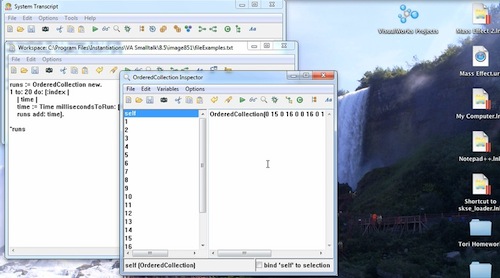
Today we'll look at more fine grained benchmarking in Smalltalk - measuring the execution time of a specific block of code. Quite often, the profiling tools tell you where to look, but you then need to dig deeper to figure things out (for instance, the profiler could point you to a specific method, but that method might be long). It's pretty simple - wrap the code in a block, and then use Time>>millisecondsToRun:
results := Time millisecondsToRun: [blockOfCodeToTestHere].
Now, you'll want to run that block a number of times and average the results to get a decent snapshot of what's happening, but that's all there is to it.
Need more help? There's a screencast for other topics like this which you may want to watch. Questions? Try the "Chat with James" Google gadget over in the sidebar.
Enclosures:
[st4u307-iPhone.m4v ( Size: 2149590 )]
 .
.


